


Homepage
•
Learning Library
•
Blog
•
Students use computational thinking to analyze real problems
Expand breadcrumbs
- Learning Library
- Blog
- Students use computational thinking to analyze real problems
- Homepage
- •
- Learning Library
- •
- Blog
- •
- Students use computational thinking to analyze real problems
Students use computational thinking to analyze real problems
The poster boards on display in an Oregon middle school gym illustrate a wide range of student concerns and passions. One features data on the incidence of breast cancer, another highlights the percentage of women versus men in Congress since 1970 and yet another illustrates the effects of gendered bathrooms.
This project is not for a social studies or current events class, although it certainly touches on those subjects. This is an algebra lesson designed to teach students to solve problems using data.
Students in Sara Jenson’s eighth grade algebra class chose real-world issues they care about, selected two or more quantitative variables and used their statistical analysis skills to describe the association between them.
Their choices illustrate a tapestry of concerns from the size of the eagle population in Alaska to disparity between the number of spectators who attend women’s sporting events versus men’s.
Sue Wilson, the district’s curriculum director, wants students to understand that this is what math is all about.
“Looking at these things that you care about through the lens of data — that’s when people start listening to you,” she told the students at Spencer Butte Middle School after the presentations. “Data is a tool to get people to hear you.”
Asking students to look at a problem methodically by collecting and analyzing data is one aspect of the Computational Thinking standard within the ISTE Standards for Students.
Computational Thinking, Standard 5.b
Collect data or identify relevant data sets; use tools to analyze data sets; represent data in various ways to facilitate problem-solving and decision-making
Algebraic skills are a natural fit for computational thinking, and letting students choose their own topic ensures that they will be invested in the project. Jenson asks students to use data that brings awareness to an issue by selecting two or more quantitative variables, describing how the two variables are associated and interpreting the math.
Students were expected to find at least eight data points, primarily through online research. Although they all did their own individual projects, they were encouraged to work collaboratively, asking each other for help, finding data, explaining that data to each other.
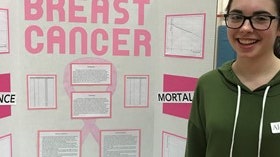
Alex McCaslin, whose mother was diagnosed with breast cancer in close timing with two other family friends, wanted to know how often women received that diagnosis, and, out of those, how many survive. She found data on breastcancer.ca on incidence versus mortality dating back to 1995.
All students represented data on two quantitative variables on a scatter plot, and describe how the variables are related. Once Alex found the data, she transferred it to Desmos, an online graphing calculator. In her analysis, she discussed the r-value, r-squared value, residual plot and the equation of the line for two graphs. For instance, the incidence rate data had an equation of y = -.62x + 135. This means that the number of women per 100,000 who are diagnosed with breast cancer decreases by 0.62 cases each year.
Even though rates are decreasing, the incidence is still too high for those who are personally affected, she says. “The data I analyzed could bring awareness to this issue by showing people how many women are affected by breast cancer each year,” she says. “People won’t believe your claim of how many women deal with this unless you prove it to them with actual evidence.”
Students created poster presentations to share with school district administration, board members, local university professors and other interested community members. They had to practice explaining their presentations in a way that described the mathematics in real-life terms, so anyone could understand it.
Adding in data collection
With a little imagination, it’s easy to see how these kids could take their algebra projects to the next level and develop potential solutions to the problems. One student is already on the way.
Sylvie Burke wanted to research the effects that having a non-gendered bathroom has on her fellow students. She interviewed 12 other students about how often they used the restroom and, on a scale from 1 to 10, how safe they feel while doing so.
What Sylvie discovered was that the less safe her fellow students felt about the bathroom, the less likely they were to use it. Using her data, Burke and her fellow Gay Straight Alliance members asked staff to give up a bathroom to make it non-gendered.
She didn't mind the extra work involved in collecting her own data. “I decided I might as well find my own data and do something that was relevant to me and our community,” she says.
Sylvie Burke's data on gender neutral bathrooms.
Learning how to talk about data
McCaslin says the agency she was given made this project a more interesting and practical way of learning important concepts.
“We learned how to tell if certain regressions (linear, exponential, quadratic, cubic, etc.) were a good fit or not for our data from our residual plot,” she says. “We also learned how to go into depth on how to describe the data using a real-world example that we care about.”
Some of the subjects the kids chose are difficult problems, but Jenson feels like they are ready to have those challenging conversations. With the computational thinking skills to analyze data, they’re also ready to offer solutions.
“These are the kids who are going to change the world,” she says.
Jennifer Snelling is a freelance writer based in Eugene, Oregon, and mom to two digital natives.